Exportera en mätning
I den här guiden kommer du att lära dig hur du exporterar filer, vilka format du kan exportera till och vilka konfigurationsalternativ du kan välja för att anpassa de exporterade filerna.
Last updated
I den här guiden kommer du att lära dig hur du exporterar filer, vilka format du kan exportera till och vilka konfigurationsalternativ du kan välja för att anpassa de exporterade filerna.
Last updated
Du kan exportera mätningar för att dela dem med kollegor eller kunder och/eller använda dem i andra applikationer. Du kan även exportera mätningar för att säkerhetskopiera dem.
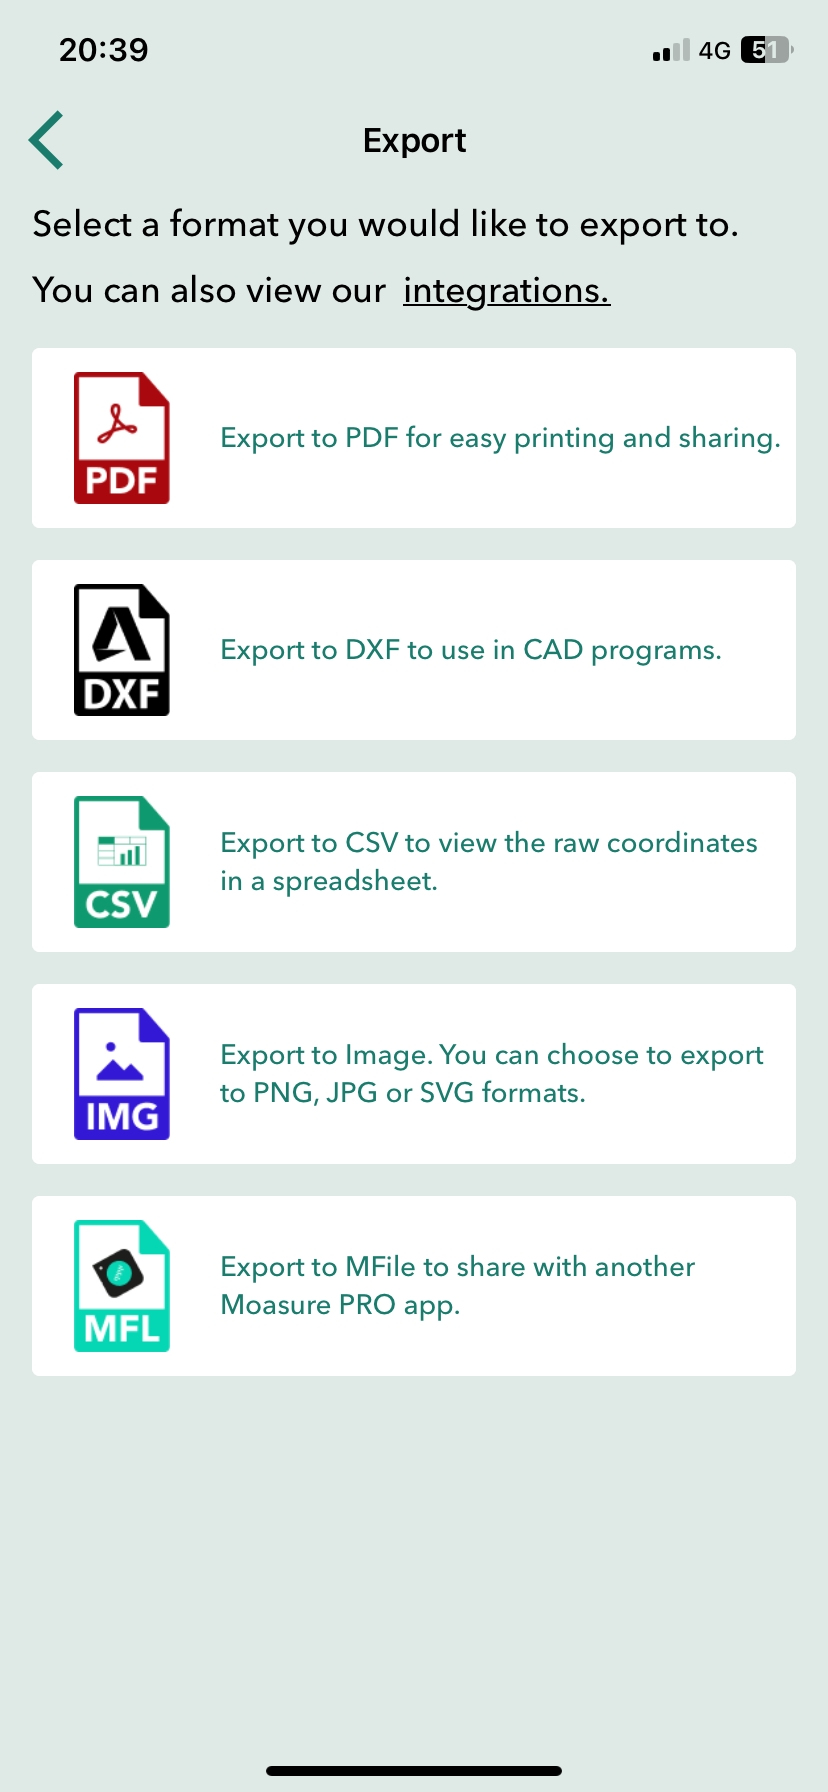
PDF (Portable Document Format) för enkel utskrift och delning.
DXF (Drawing Exchange Format) för användning i CAD-program.
CSV (Comma Separated Values) för att visa de råa koordinaterna i ett kalkylblad.
Bild: Du kan exportera till PNG-, JPG- eller SVG-format.
MFile: Exportera till MFile för att dela med en annan Moasure-app.
Öppna Moasure-appen och välj den mätning du vill exportera genom att gå till Filer längst ned i appen och sedan välja Öppna.
När mätningen har laddats, tryck på Arkiv > Exportera.
Välj önskat exportformat från de tillgängliga alternativen.
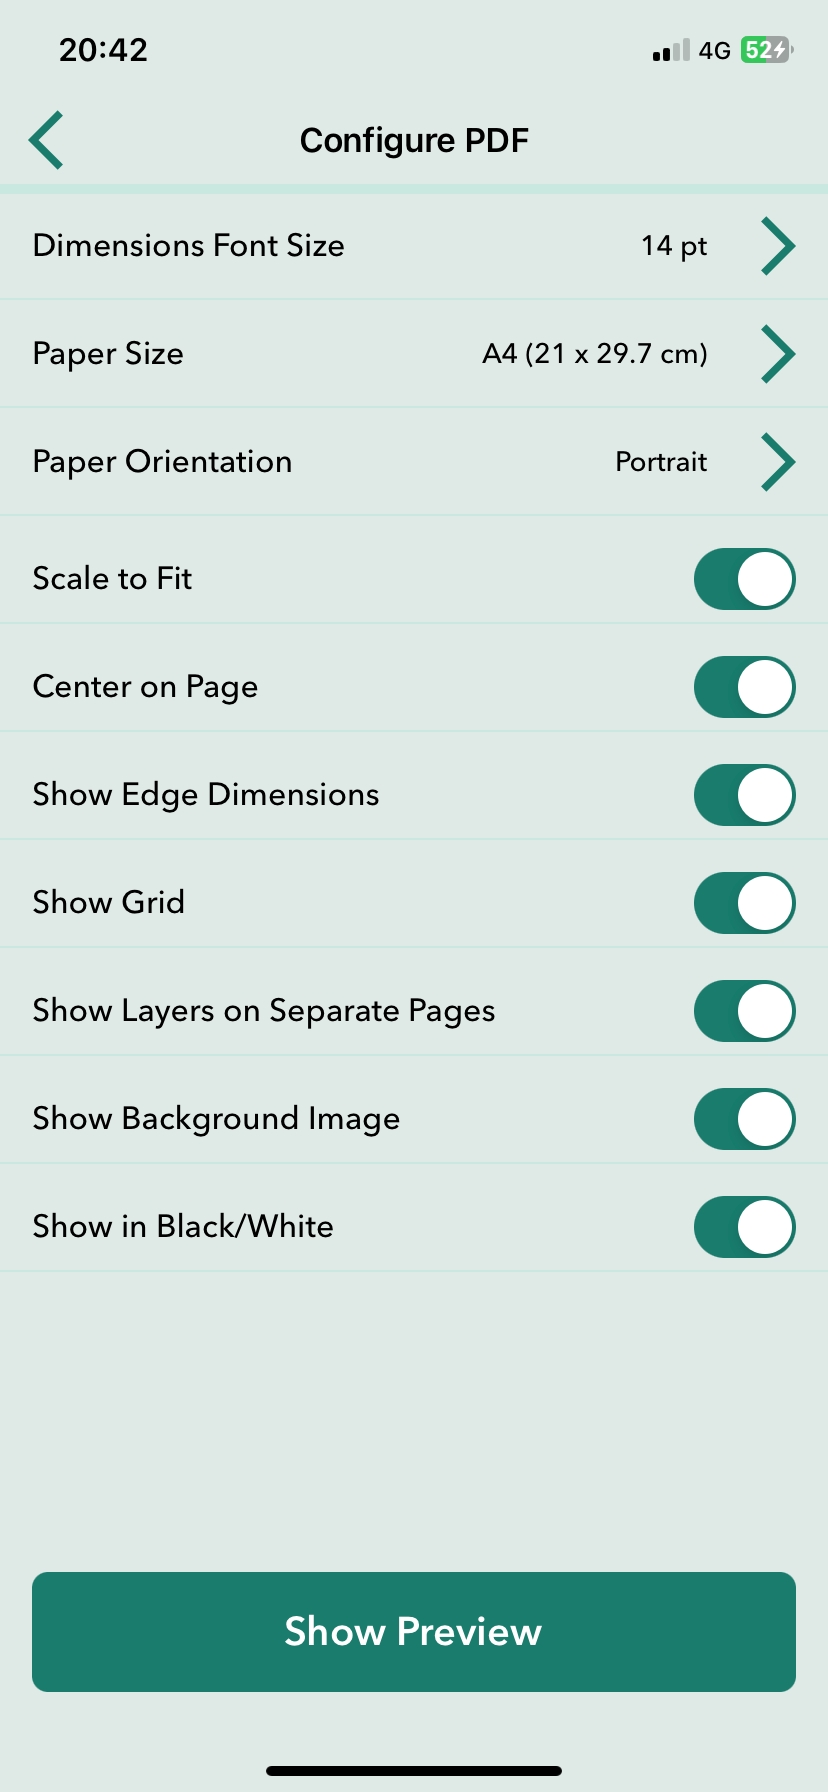
När du exporterar till PDF kan du välja att ändra de förvalda konfigurationsalternativen för att anpassa PDF efter dina önskemål. Du kan förhandsgranska hur konfigurationsalternativen påverkar PDF innan export genom att trycka på Visa förhandsgranskning längst ned på PDF-konfigurationsskärmen.
De konfigurerbara alternativen förklaras nedan:
Teckenstorlek för dimensioner. Storleken på teckensnittet som används i hela PDF-dokumentet.
Pappersstorlek. Storleken på pappret som PDF kommer att exporteras till. Du kan välja mellan ett brett utbud av alternativ, inklusive A0 till A4, samt tekniska pappersstorlekar som ANSI C till E.
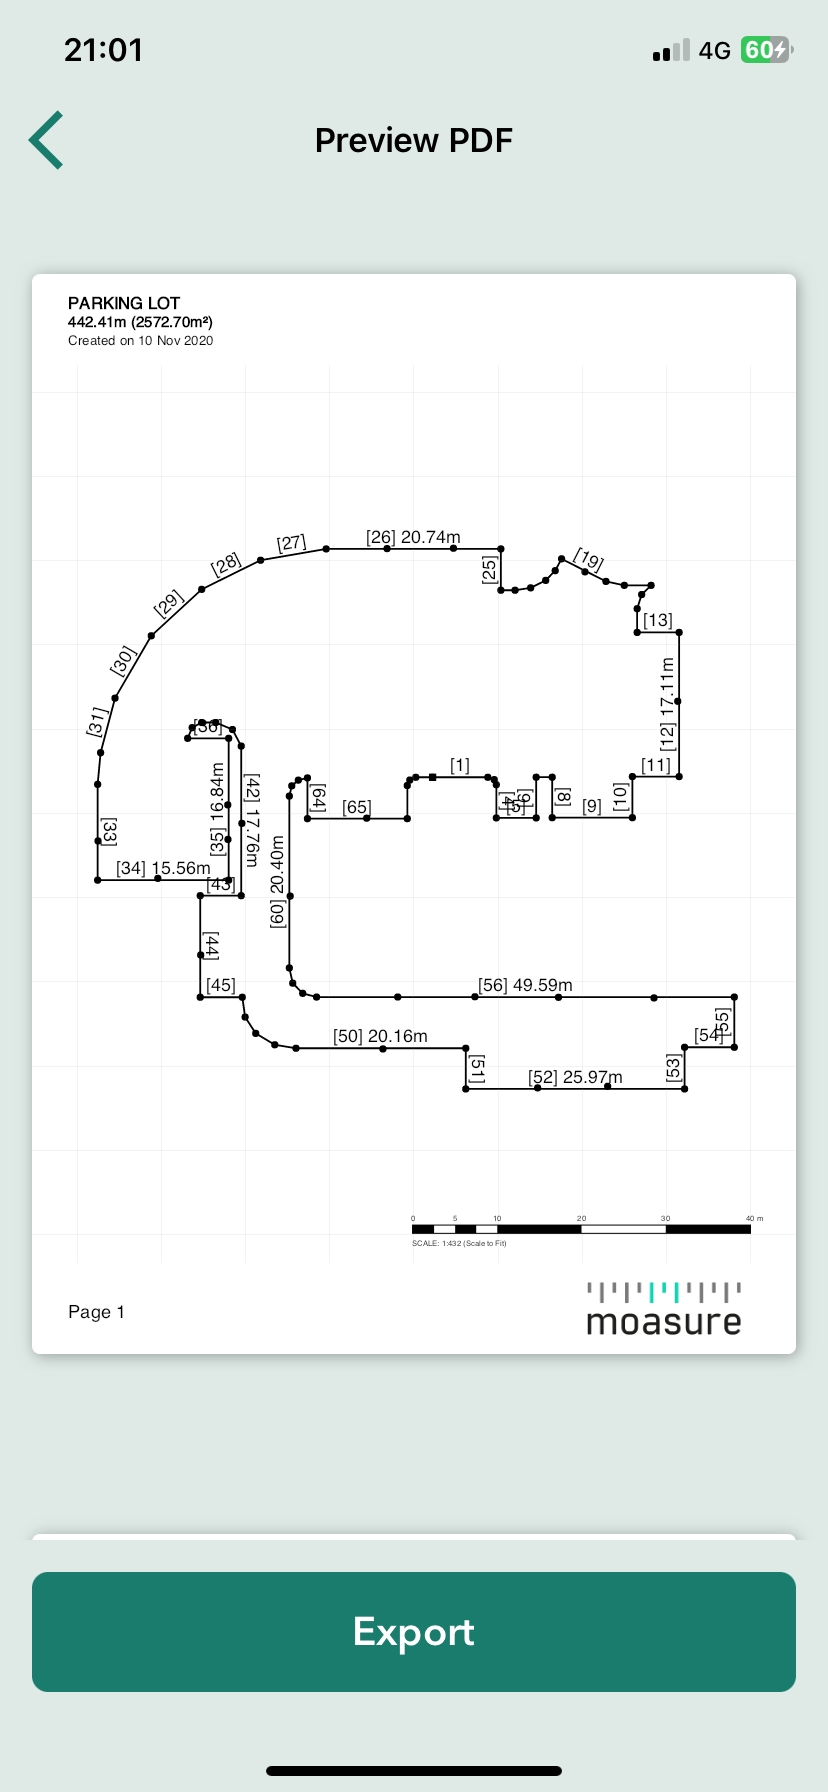
Skala för att passa. Skala för att passa är förvalt aktiverat. Denna alternativ skalar automatiskt ner eller upp mätningen för att passa de valda pappersstorlekens dimensioner. När det är aktiverat analyserar PDF-exportprocessen innehållet och den valda pappersstorleken. Om innehållet är större än den valda pappersstorleken, skalas det ned proportionellt för att passa inom det tillgängliga utrymmet. Detta säkerställer att hela innehållet är synligt och kan skrivas ut på den valda pappersstorleken. Om innehållet däremot är mindre än den valda pappersstorleken, kan "Skala för att passa" skala upp det proportionellt för att maximera användningen av pappersutrymmet. Detta hjälper till att undvika att små innehåll ser för små ut på större pappersstorlekar.
Förinställd skala. Du kan välja en förinställd skala genom att stänga av alternativet Skala för att passa. Du kan sedan välja från ett brett utbud av skalor, från 1:1 till 1:500. Varje export med en vald skala (oavsett om det är Skala för att passa eller Förinställd skala) har en skala-ruta med ett skalaförhållande som visar relationen mellan mätningarna på pappret och motsvarande mätningar i verkliga livet. Det ger en visuell representation av den skala eller förhållande som används för att representera avstånd. För att ge ett exempel: om du har valt en skala på 1:5 betyder det att varje enhet av mätning på pappret (i detta fall 1 cm) representerar en större mätning i verkliga livet (i detta fall 5 cm). Så för varje 1 cm du mäter på pappret, motsvarar det 5 cm i den verkliga världen. För att illustrera detta ytterligare, om du mäter en kant på pappret och den är 4 cm lång, kan du beräkna den verkliga längden genom att multiplicera den med skalfaktorn. I detta fall skulle 4 cm på pappret representera en längd på 20 cm i verkliga livet (4 cm x 5 = 20 cm).
Dessutom visas ett rutnät av rutor bakom mätningen. Dessa rutnät rutor kan användas för att uppskatta storleken på mätningar i verkliga livet. Rutnätet fungerar som en visuell referens, vilket gör att du kan bedöma de relativa storlekarna på mätkanterna och den totala mätningen. Kom ihåg att du alltid kan slå upp det verkliga värdet av mätkanterna på Kantsidan i PDF
Se nedan ett exempel på en PDF som exporteras med alternativet Skala för att passa.
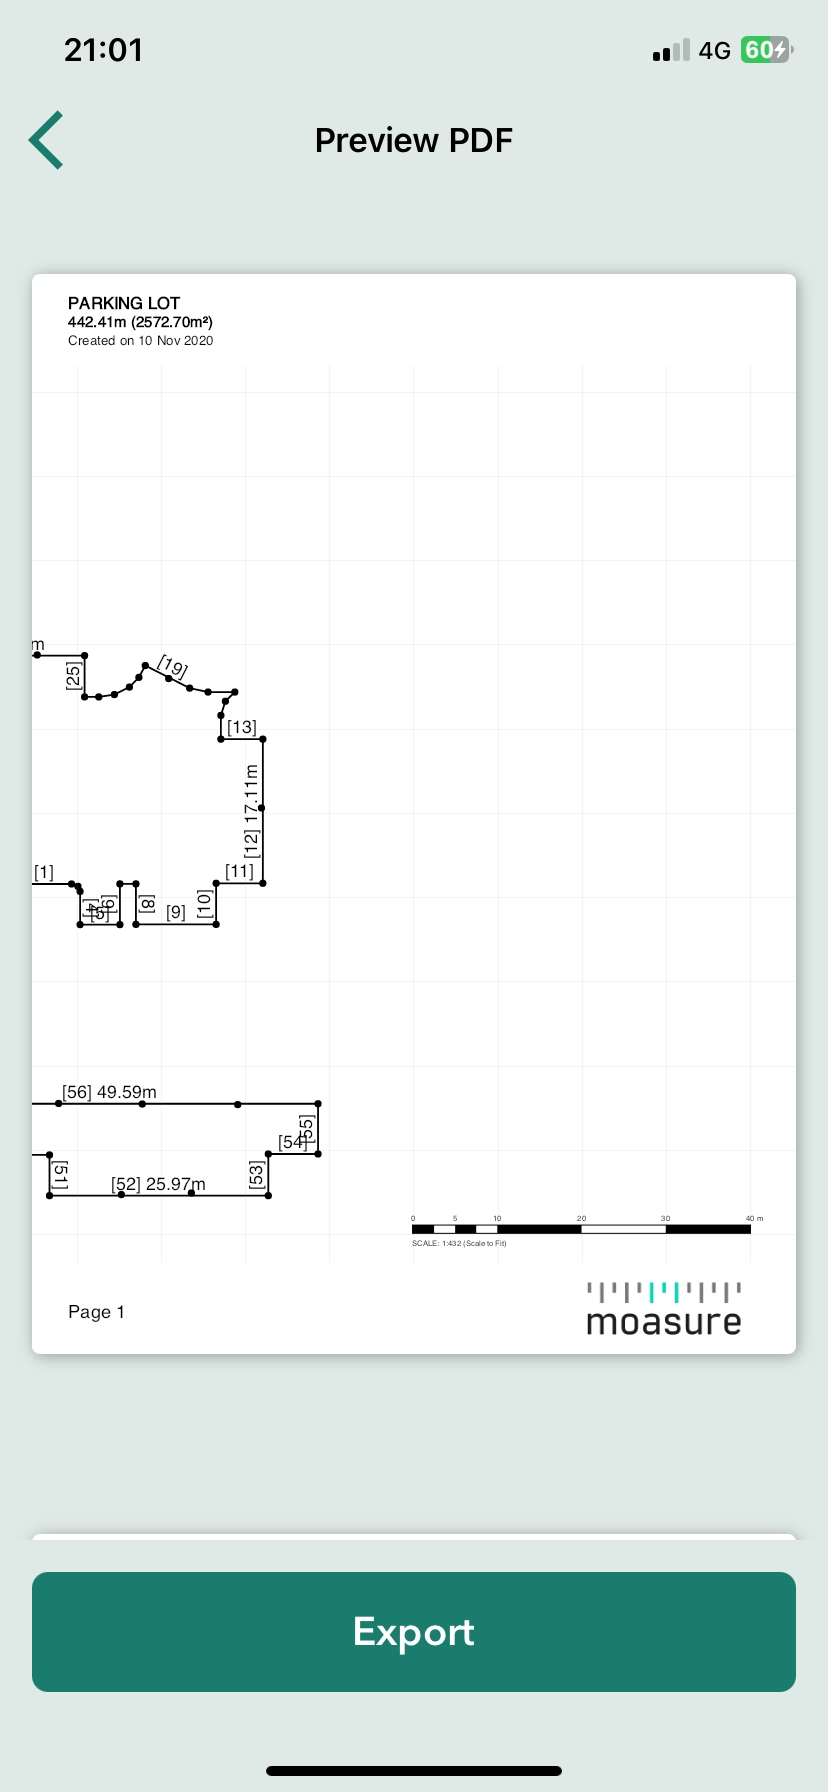
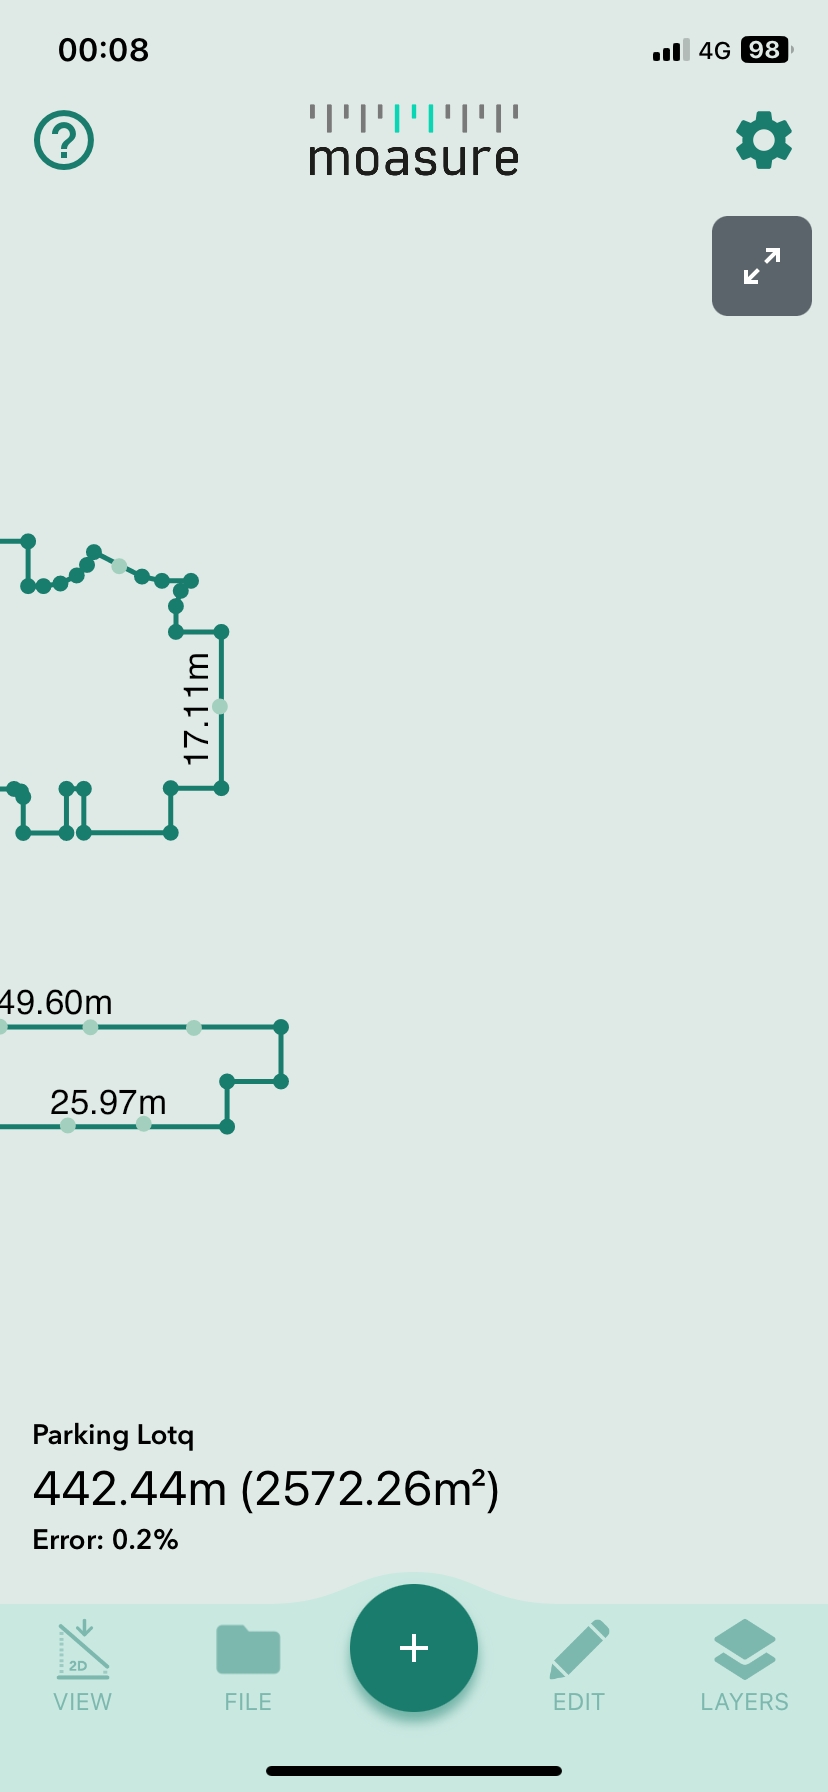
Centera på sidan. Alternativet Centera på sidan är förvalt aktiverat och centrerar mätningen på sidan även om mätningen dras till vänster eller höger på appens duk innan export. När detta alternativ stängs av kommer mätningen inte att vara centrerad. Detta kan vara användbart när du bara vill exportera en del av mätningen (den del som visas på appens duk). Se nedan exempel på samma PDF med alternativet Centera på sidan aktiverat respektive inaktiverat.
Show Grid. This option is selected by default. This option shows a light square grid on the PDF.
Show Layers on Separate Pages. This option is selected by default. When enabled, it will show Layers (in multi layer measurements) on the PDF by rendering each layer on separate pages.
Show in Black/White. This option enables you to export the PDF in black/white rather than in the default colours. This is useful when you want to export in higher contrast or simply save on ink.
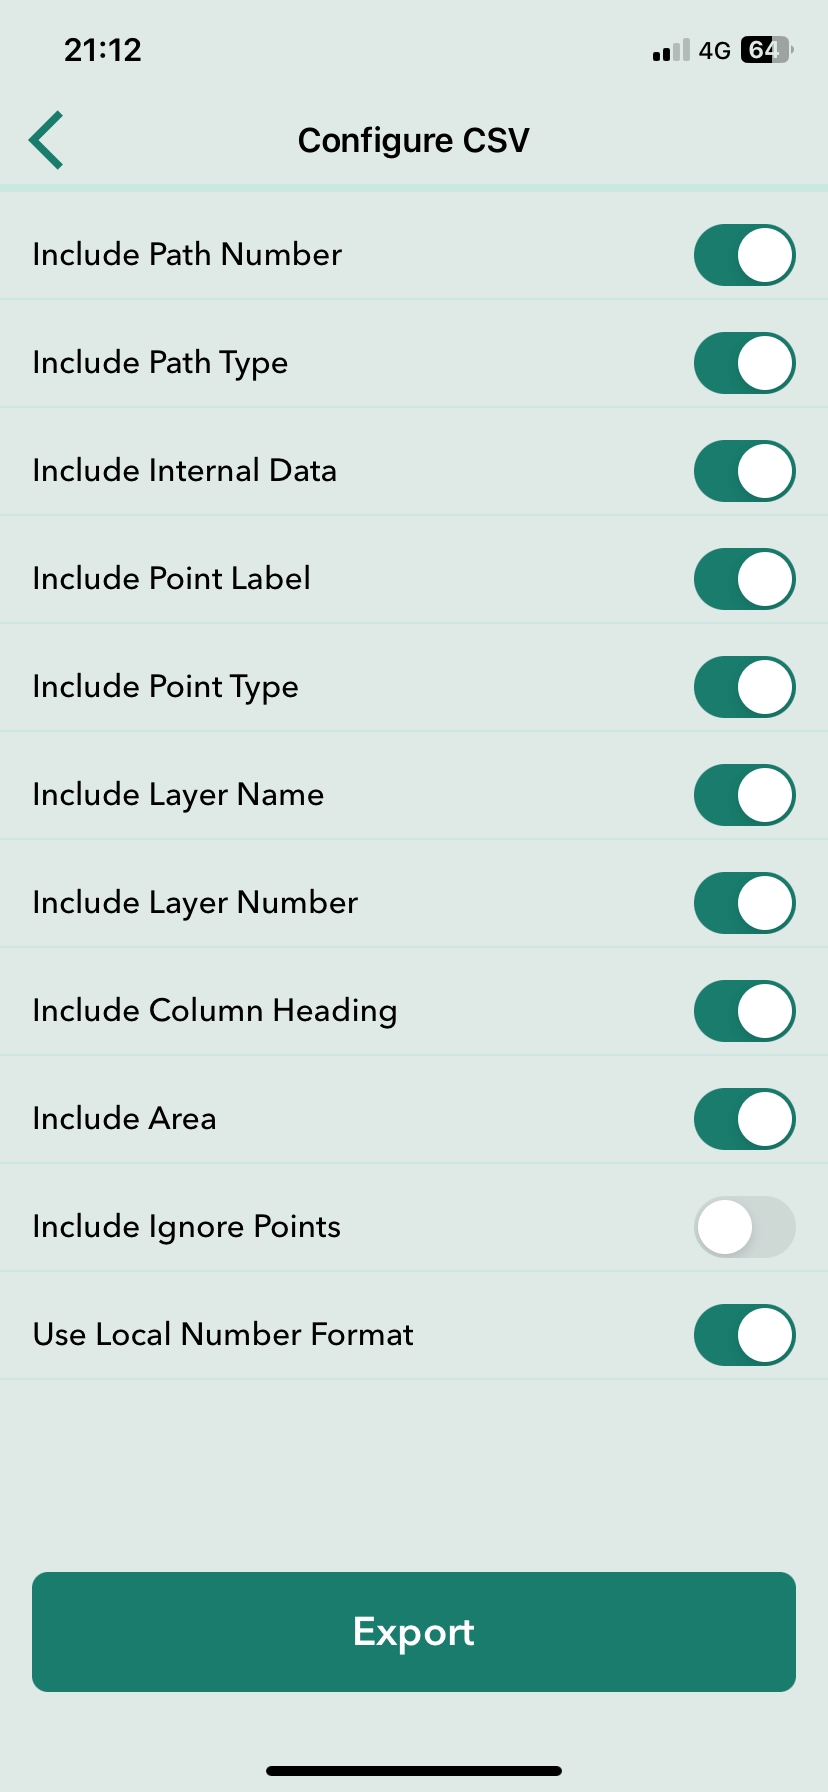
When exporting to CSV, you can choose to change the default configuration options to customise the CSV to your liking.
The configurable options are as followed:
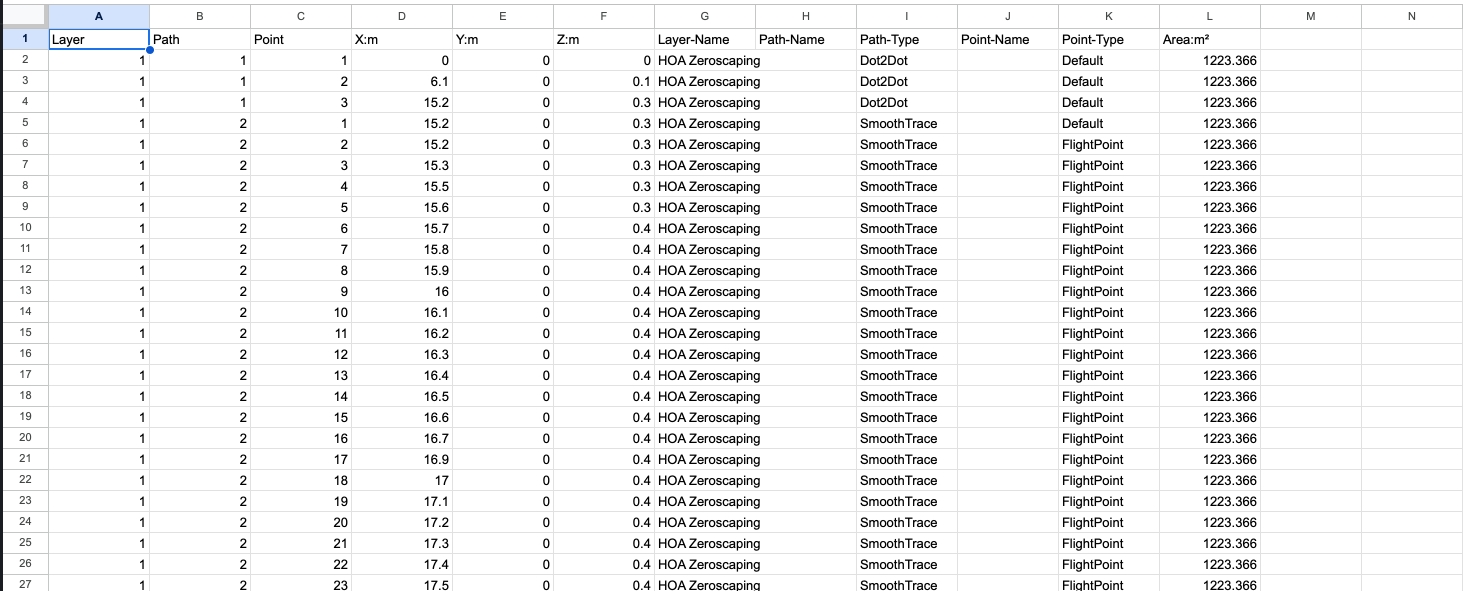
Include Path Type. Adds a column and value for the Path Type of the recorded point. The Path Types in the CSV do not always map to the values in the UI. Below is a mapping table to help you understand the meaning of the CSV values.
Dot2Dot
SmoothTrace
Trace
LastLeg
Null
Include Point Type. Adds a column and value for the Type of the recorded point (e.g. default, FlightPoint). A Point Type can be one of the following:
Default
This is a normal pause point.
IgnorePoint
This is a normal ignore point.
FlightPoint
This is an exact sample point on a Trace and Smooth Trace Path.
CenterPoint
This is a point on the centre of an Arc/Circle.
ArcPoint
This is a point on an Arc/Circle Path.
WallPoint
This is a point on a Wall Path.
Include Layer Name. Adds a column and value for the name of the layer the recorded point is in (e.g Base Layer).
Include Layer Number. Adds a column and value for the layer number. The number corresponds to the chronological order the layers are added in. To give an example; if you have added one layer to your measurement, there will be two layers in total. The first layer (base layer) will be number 1 and the second (added) layer will be number 2.
Include Column Heading. Adds column heading names on the first row.
Include Area. Adds a column and value for the area.
Include Ignored Points. Adds Ignored points to the CSV.
Use Local Number Format. Uses local number formatting for displaying the number values. To give an example; when enabled, a user in the UK will have the square meter number formatted as 150.65 whilst a user in Spain will have the same number formatted as 150,65. See below an example of CSV file and image that is exported with all configuration options enabled.
When exporting to DXF, you can select from two options:
3D. Includes elevation data.
2D. Flattens data by removing elevation.
When exporting to Image, you can select from three options:
PNG.
JPG. Great for optimised file sizes.
SVG. Great for transparent background.
There are no configuration options for MFiles.
Besides exporting single files, you can also export multiple files at once. To do so, follow the steps below.
Tap on File > Multi Export in the bottom toolbar.
Select the files you want to export or select a whole folder.
Select the desired export format from the options provided.
Obs: Du kan även exportera flera filer samtidigt. För att lära dig hur du gör detta, gå till
Show Background Image. This option is selected by default. When enabled and when a background image is added to the measurement through the, it will add the background image to the PDF.
Include Path Number. Adds a column and value for the number of the recorded point. The number corresponds to the order of the Path Types in the measurement. To give an example; the first Path Type measured will be number 1. If the Path Type is consequently changed (e.g. from to ), the new path number will be 2. If only one Path Type is used in the measurement, all Path Types will have the number 1.
Trace Line (with the option of enabled in settings).
The dashed line that is sometimes added by the
Include Point Label. Adds a column and value for the Label of the recorded point added through the
