In diesem Leitfaden erfahren Sie, wie Sie in der Moasure-App navigieren und Messungen anzeigen können. Wir behandeln verschiedene Anzeigeoptionen und Werkzeuge, die Ihnen helfen, Ihre Daten effekt
Ab der App-Version 2.0 wurden die Ansichten verbessert. Sie sind jetzt auf der Leinwand zugänglich und wurden um Oberflächen- und Konturansichten erweitert.
Wenn Sie ein Messung abschließen, wird jeder gewählte Pfadtyp (z. B. Gerade, Bogen, Frei) zwischen den Messpunkten angezeigt. Tippen Sie zweimal auf eine beliebige Stelle des Bildschirms. Um die gesamte Messung sichtbar zu machen, verschieben Sie die Darstellung mit dem Finger. Mit zwei Fingern können Sie rein- und auszuzoomen, oder streichen Sie mit dem Finger, um die Darstellung nach links oder rechts zu drehen.
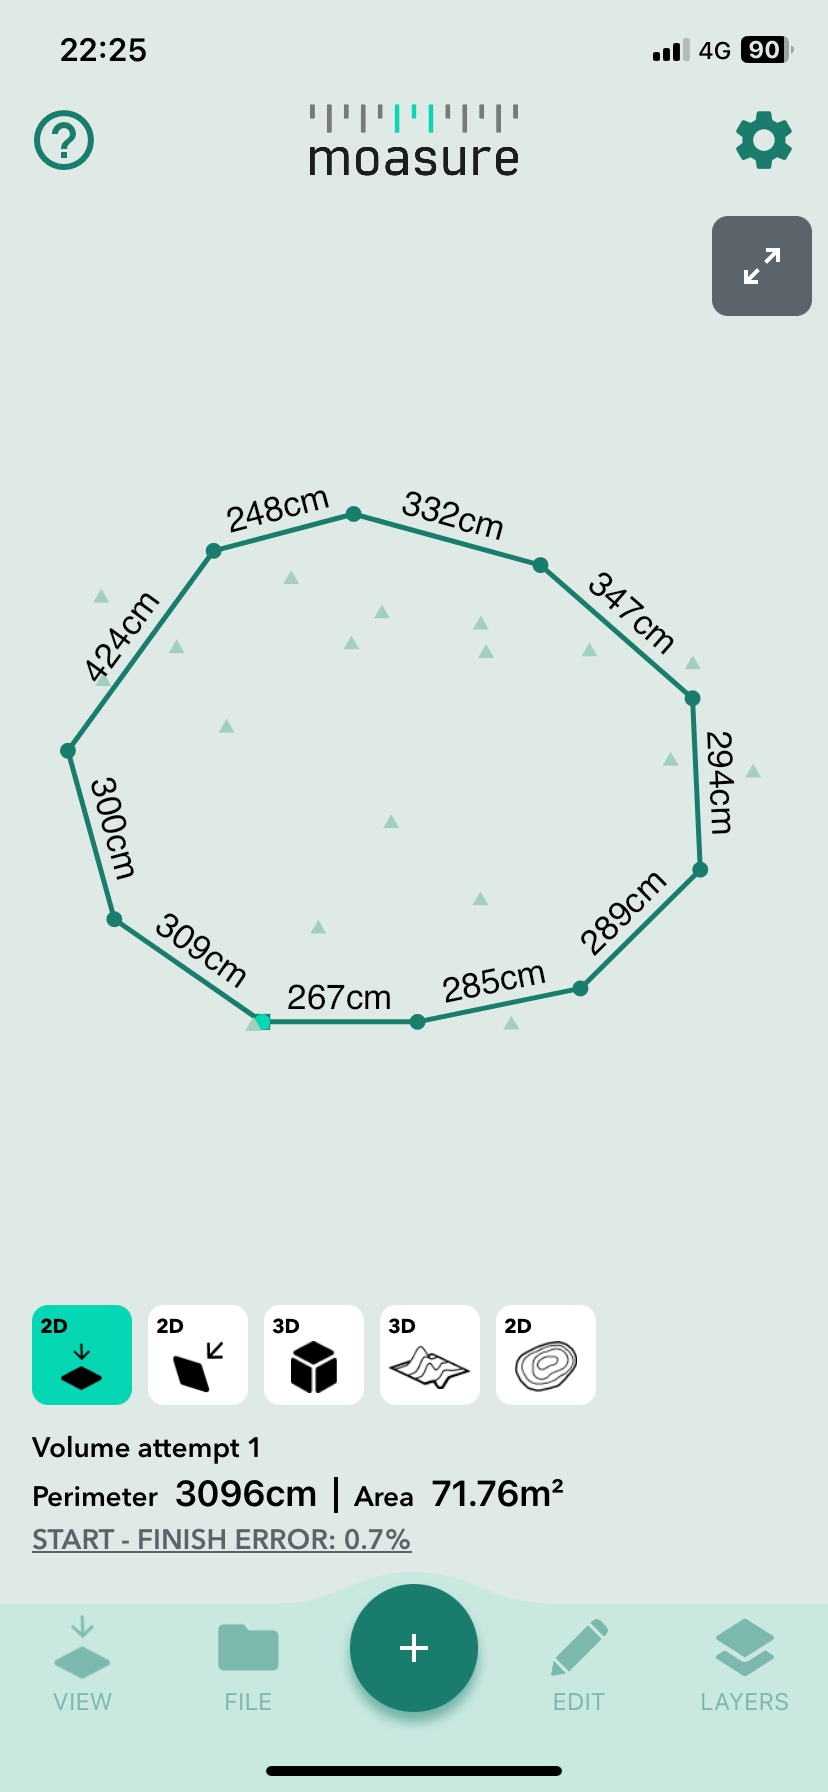
2D Plan bietet eine Top-Down-Perspektive Ihrer Messung, so dass Sie den Umfang und die Fläche deutlich sehen können. Tippen Sie auf einen einzelnen Messpunkt, um die relativen XYZ-Koordinaten, einschließlich der Höhe, zu sehen. Tippen Sie auf einen beliebigen Messpunkt auf Ihrem Bildschirm, um die Ansichtssymbole wieder anzuzeigen.
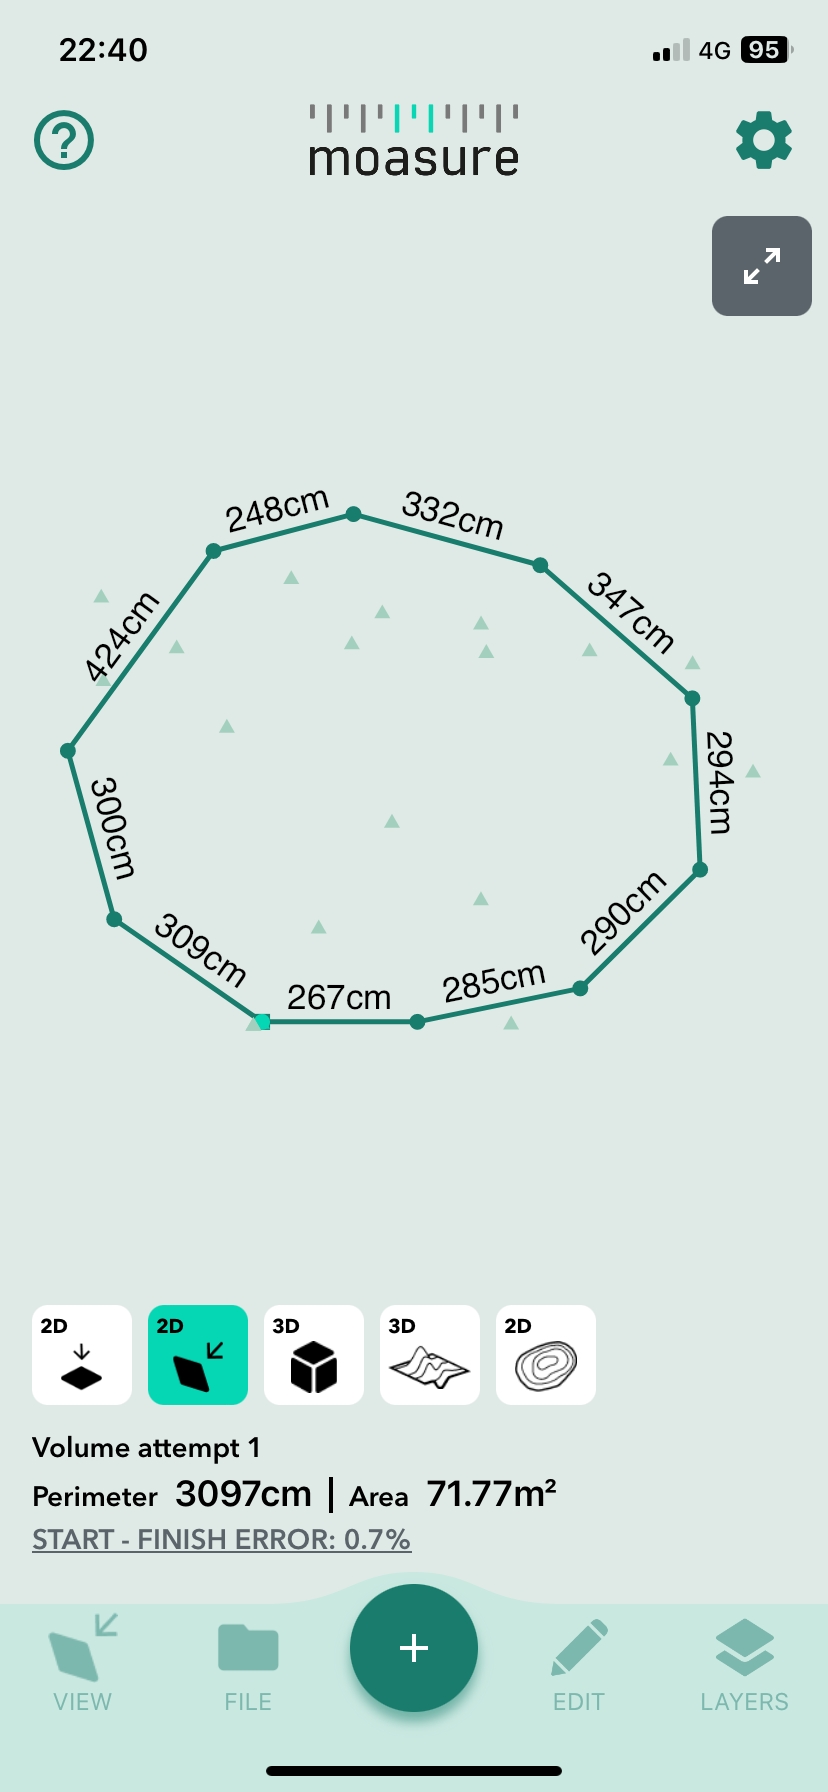
Wenn Ihre Messung nicht horizontal, sondern schräg verläuft, passt sich diese Ansicht an den Winkel der Schräge an und berichtigt Abmessungen und den Flächeninhalt entsprechend. Beachten Sie, dass der Wechsel zu 2D-Schrägansicht auf einer horizontalen Ebene keine wesentliche Änderung der Ansicht bewirkt.
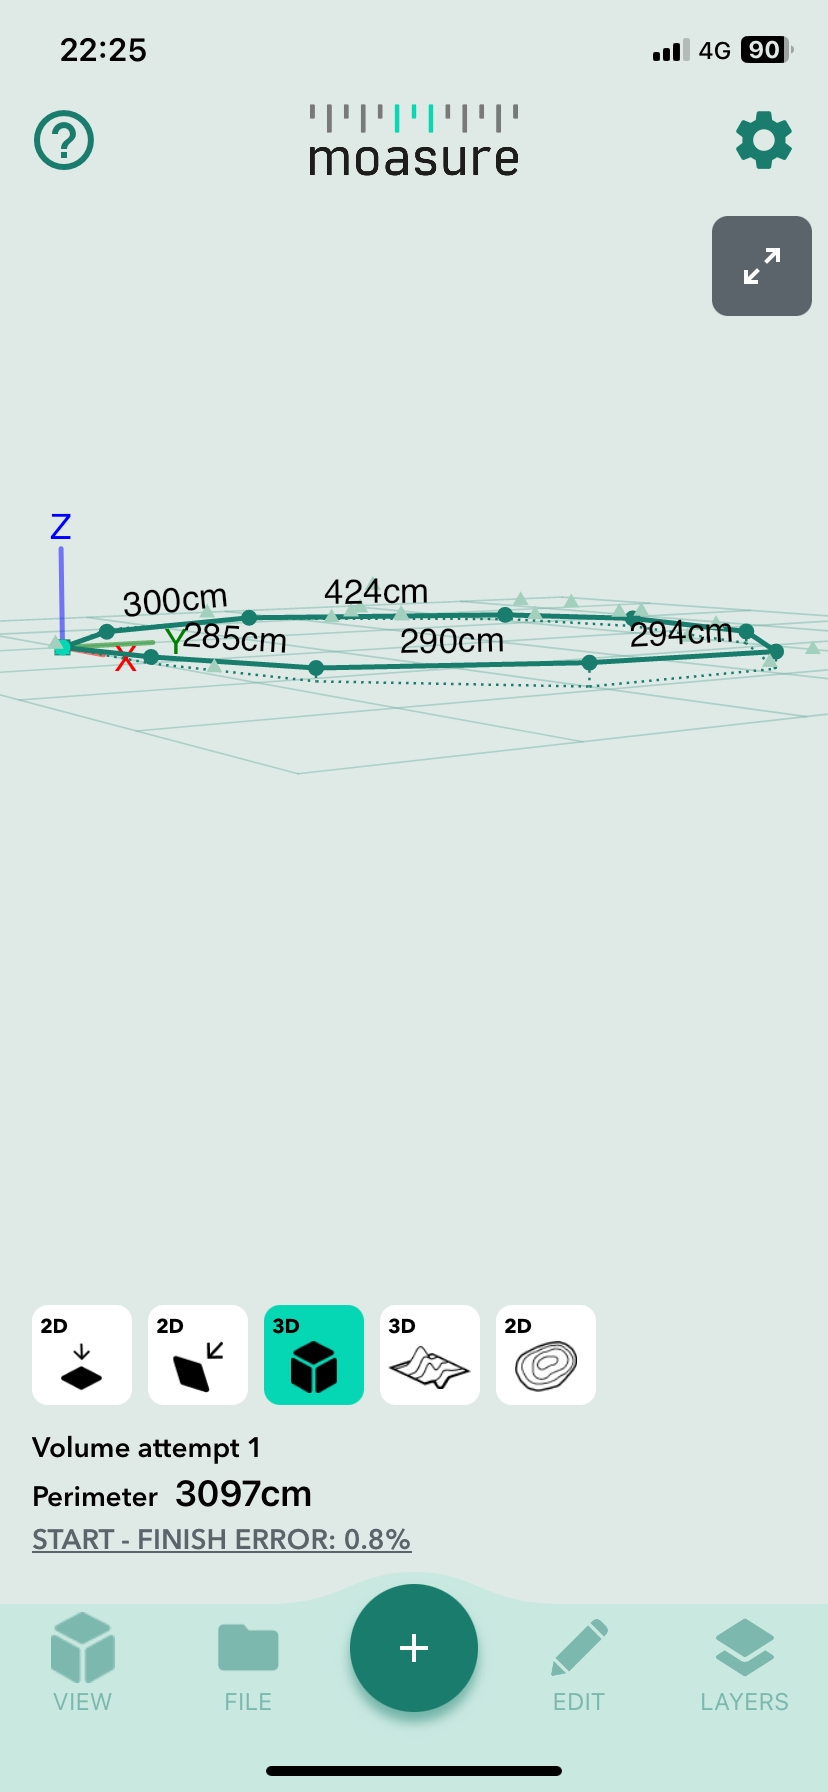
Um Messungen in drei Dimensionen wie z. B. Erhebungen oder Neigungen zu untersuchen, tippen Sie auf das Symbol des 3D-Würfels. Damit wechseln Sie in die 3D-Würfelansicht, in der Sie durch Auf- und Zuziehen der Finger zoomen und Ihre Zeichnung mit einem Finger horizontal und vertikal schwenken können.
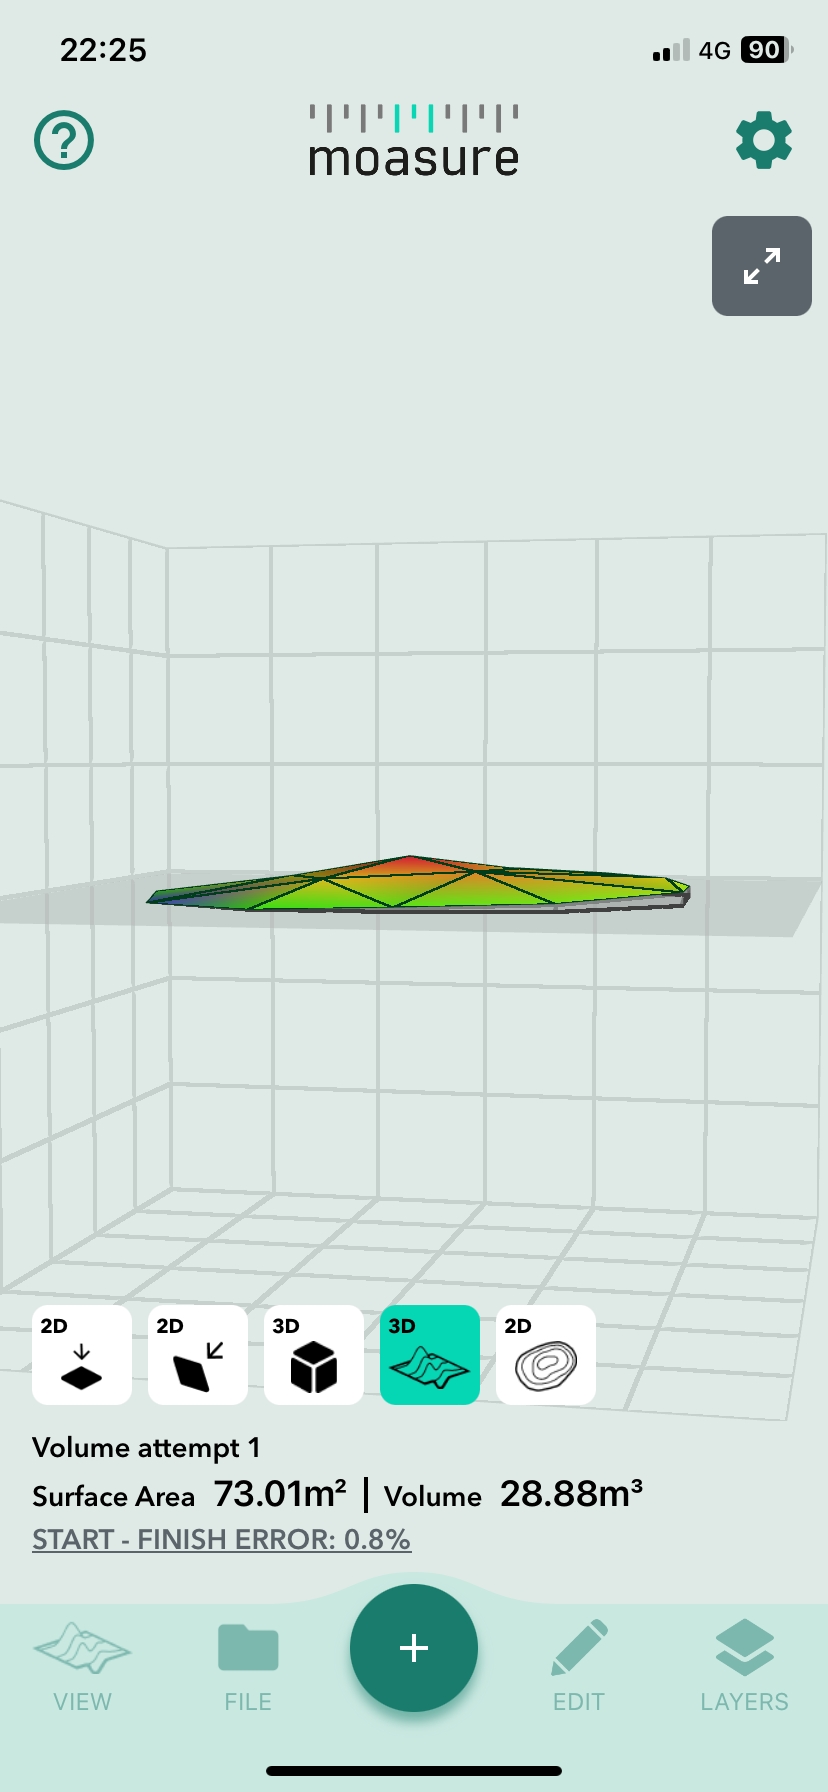
Wenn Sie auf das Symbol für die 3D-Oberfläche tippen, können Sie auf die Ansicht des Oberflächennetzes zugreifen, die durch eine Farbskala dargestellt wird, wobei Blau den niedrigsten Punkt und Rot den höchsten Punkt darstellt. Diese Ansicht bietet auch Informationen über den Oberflächeninhalt - die Summe aller Dreiecksflächen im 3D-Modell - und das Volumen, das vom niedrigsten Punkt (angezeigt als niedrigster Z-Wert) bis zur horizontale Oberfläche berechnet wird.
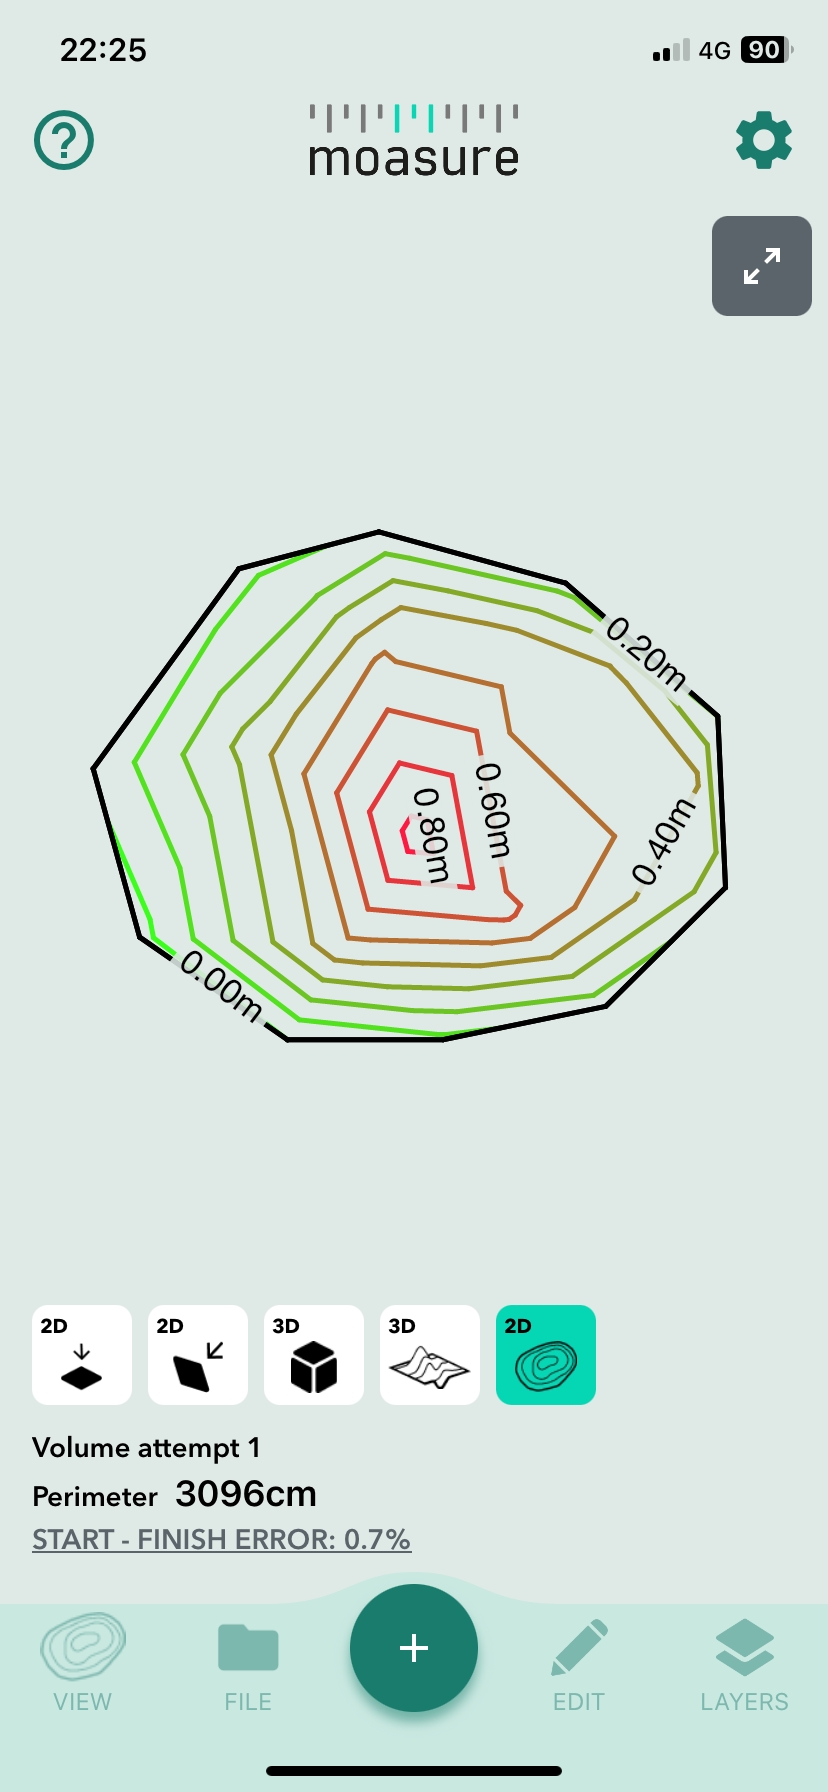
Wenn Sie für die Erfassung von Höhendaten den Pfadtyp Punktwolke verwendet haben, wechseln Sie zur Ansicht Kontur, um die topographische Karte zu sehen. Die Konturlinien stellen die Gefällestärke dar: engere Linien bedeuten steilere Gefälle, während größere Abstände sanftere Gefälle kennzeichnen. Die App stellt das Konturintervall automatisch so ein, dass es die Höhenunterschiede widerspiegelt. Verwenden Sie diese Ansicht, um Einblicke in die Topografie Ihrer Messung zu erhalten.
Wechseln Sie zurück zur Standard 2D- oder 3D-Ansicht, um mit einzelnen Elementen zu interagieren; wenn Sie auf eine Messlinie tippen, werden ihre Länge, Laufbahn und Fluglinie angezeigt. Wenn Sie einen Punkt auswählen, werden dessen Winkel und XYZ-Koordinaten angezeigt. Tippen Sie von einem ausgewählten Punkt oder einer Kante weg, um die Ansichtssymbole wieder anzuzeigen.
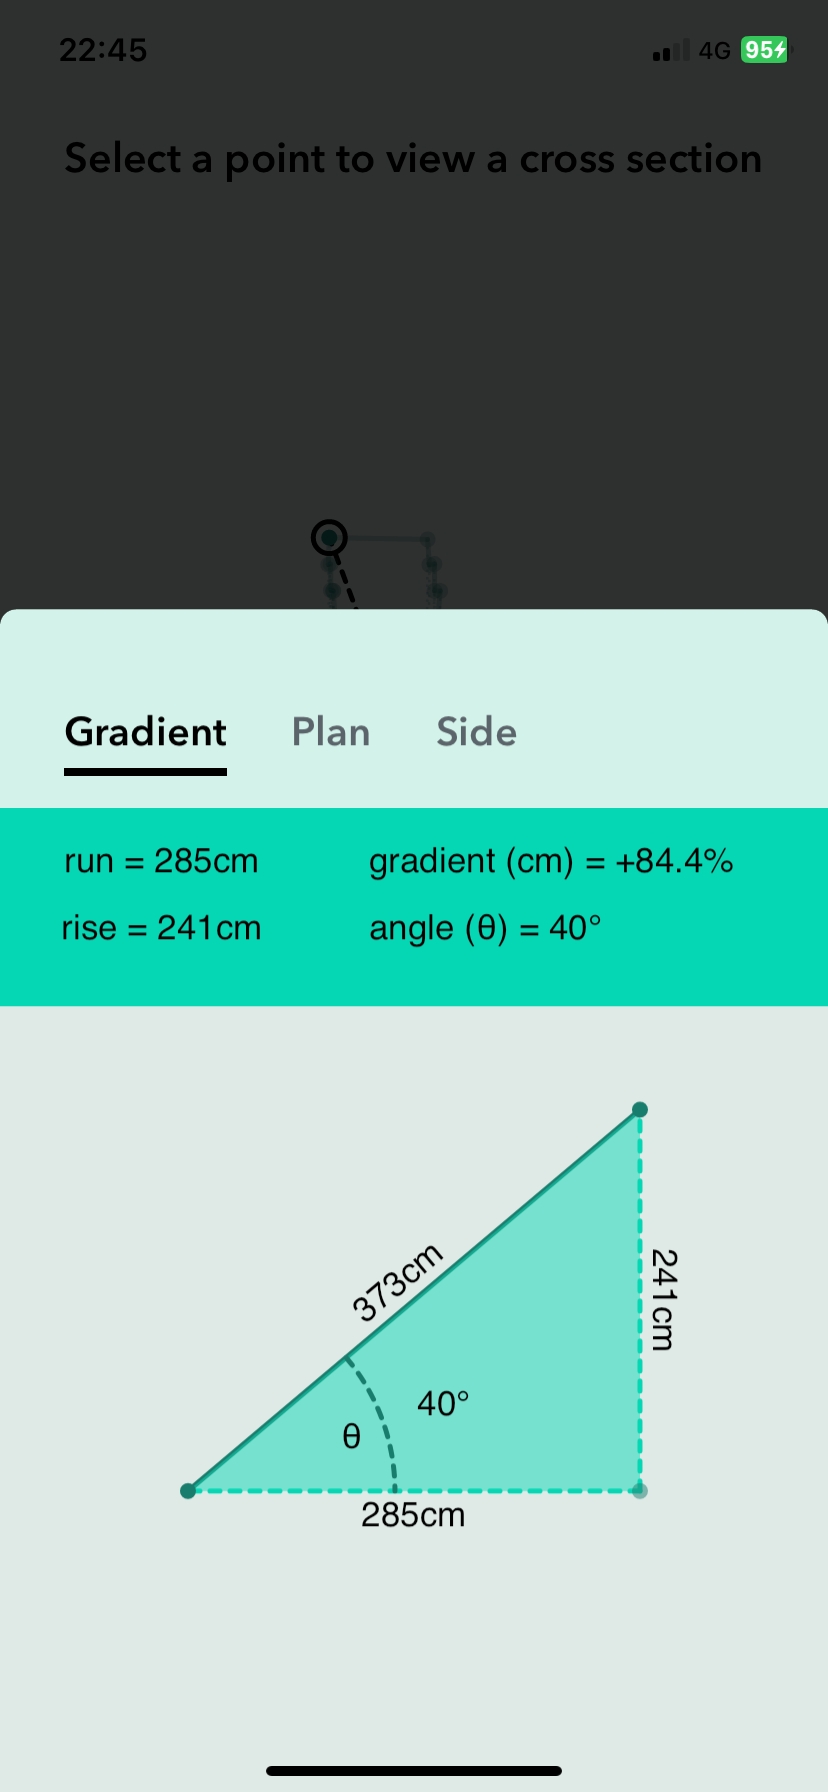
Mit Querschnitt können Sie den Abstand zwischen zwei nicht miteinander verbundenen Punkten messen. Wählen Sie zunächst den ersten Punkt aus. Tippen Sie unten links auf Ansicht. Gehen Sie auf Querschnitt und wählen Sie dann einen zweiten Punkt. Die Moasure-App berechnet nun den Abstand und den Höhenunterschied zwischen den beiden Punkten.
Durch Tippen auf das Symbol Querschnitt werden drei Unteransichten angezeigt:
Neigungsansicht: zeigt Details zur Neigung zwischen den Punkten an, einschließlich Verlauf, Neigungsprozentsatz, Steigung und Winkel.
Planansicht: zeigt eine von oben nach unten gerichtete Ansicht.
Seitenansicht: Zeigt den Höhenunterschied zwischen den Punkten an, als ob Sie sie von der Seite betrachten würden.

